
Budget vs actual dataset for variance analysis in Excel and Power BI
DATA DARE on findi360 has budget vs actual practice datasets: a manufacturer's actual results against its budget and three reforecasts a year, with revenue by product line, units and prices, so you can build a variance report and a price-volume-mix analysis. The higher level is a three-company group with many plan versions, one company on an April–March year, and the drivers behind each plan. Each set has graded questions and a Question Book; downloading needs a findi360 account and a few Data Points.
The sets live now
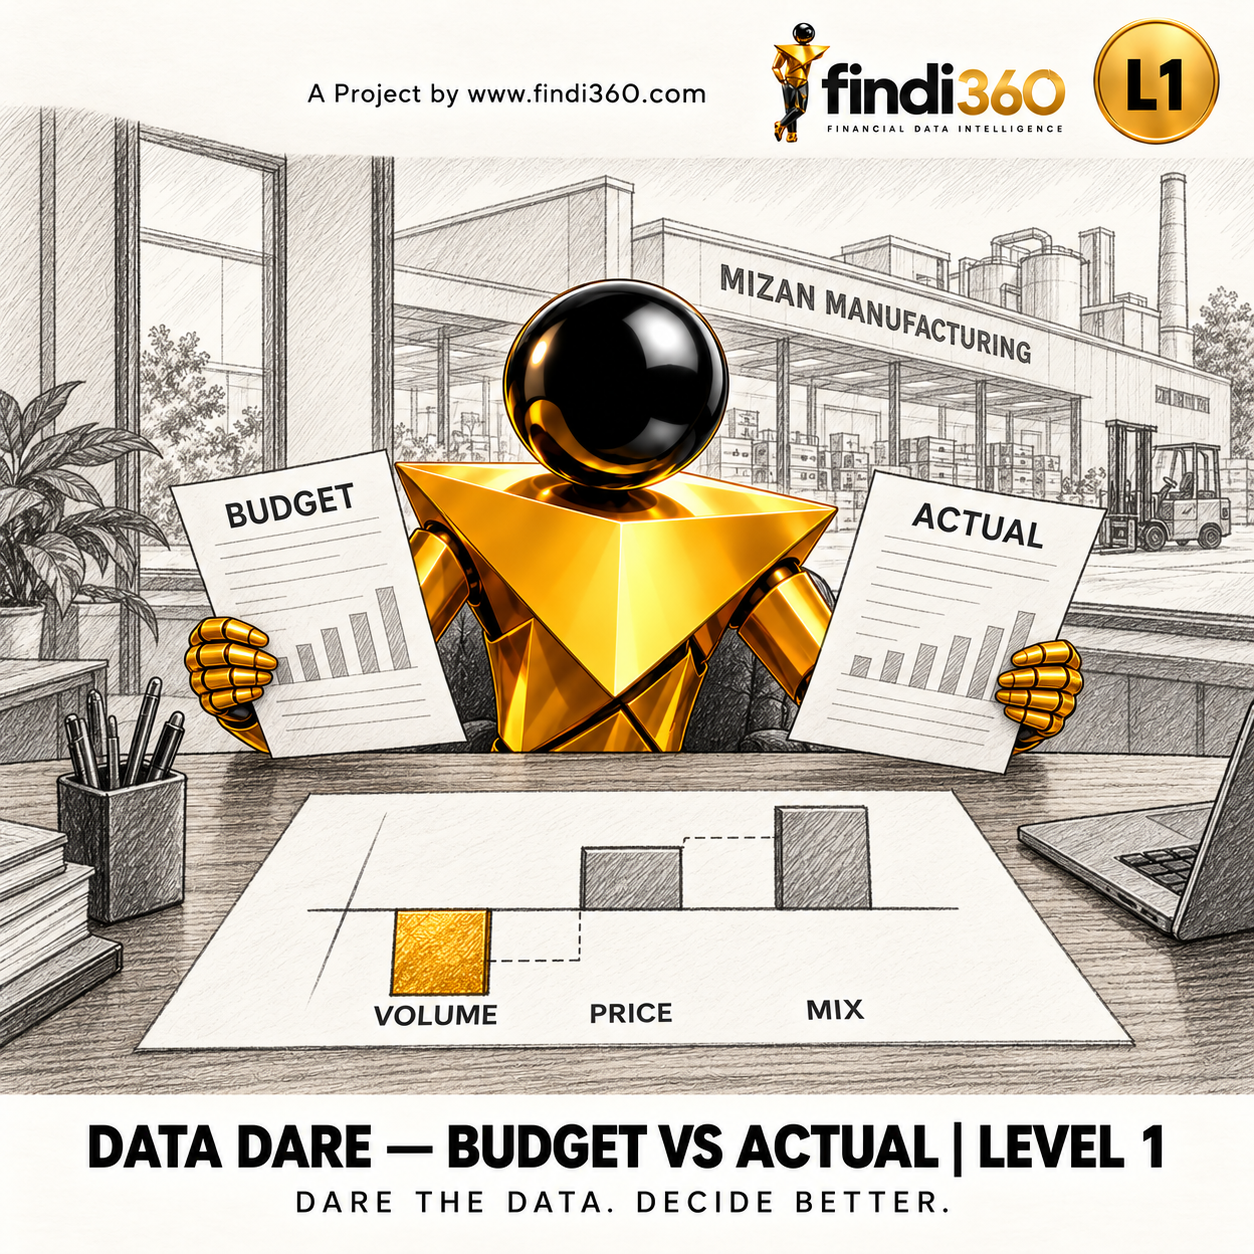
Mizan Manufacturing: The Customer Who Left — Budget, Reforecasts and Actual
Compare a manufacturer's actual results with its budget and three reforecasts a year: revenue by product line with units and prices, price-volume-mix variances,...
Get the data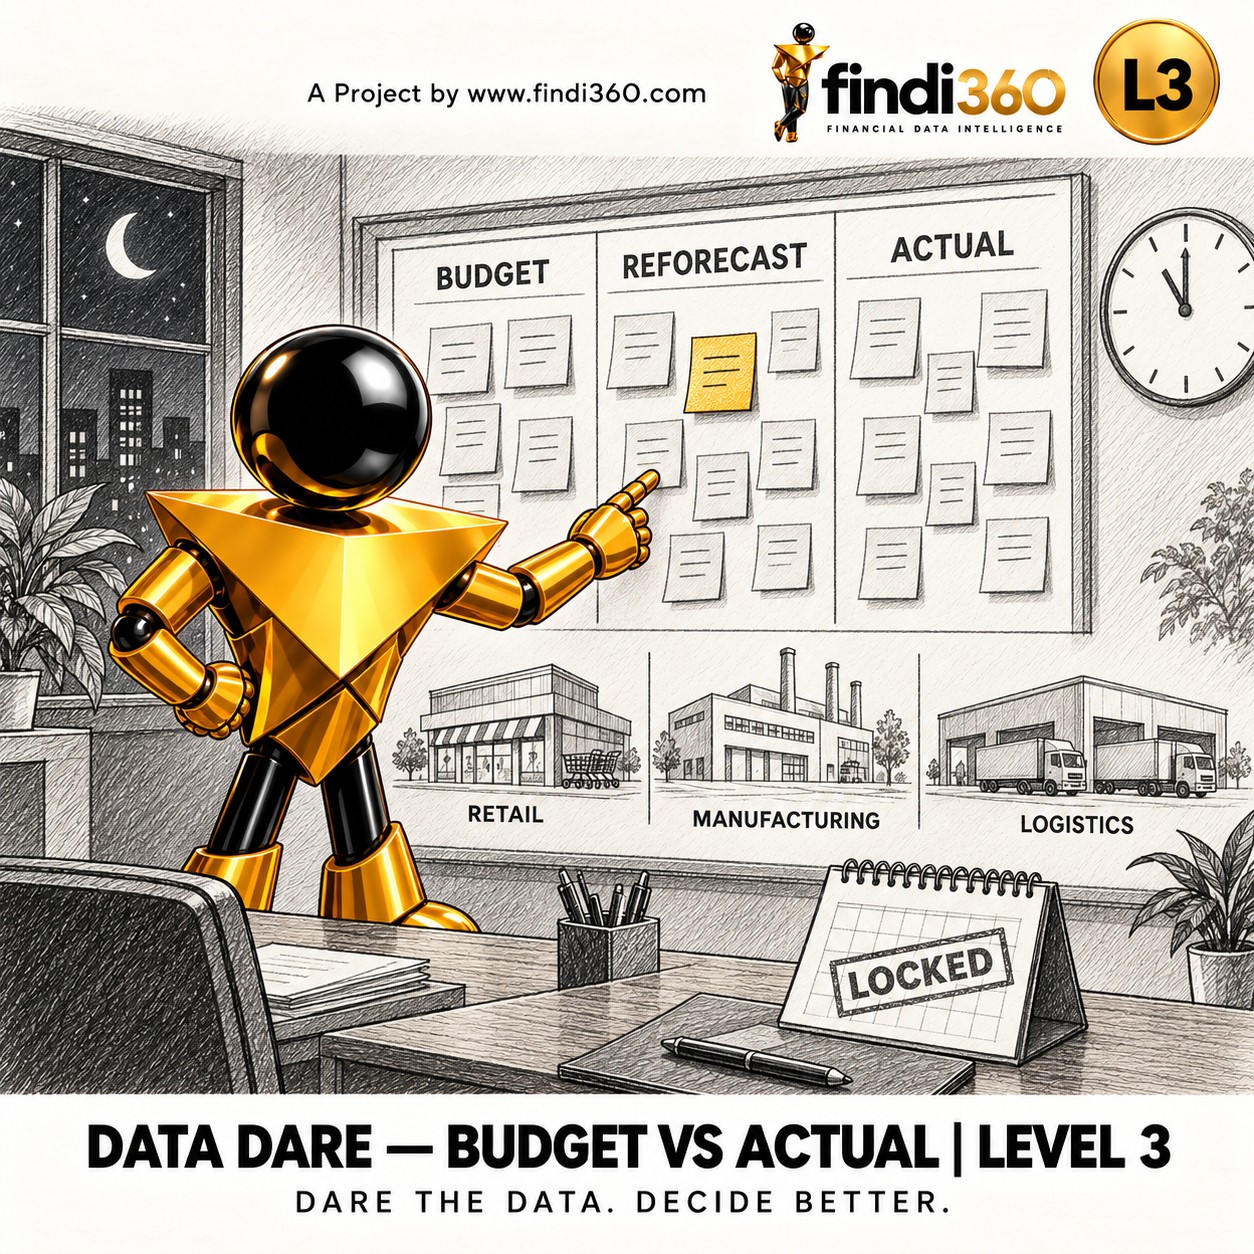
Mizan Group: Budgets, Reforecasts and the Drivers Behind Them
Explain a three-company group's results against 23 plan versions - budgets and three reforecasts a year, one company on an April-March year - using daily actual...
Get the dataWhat is in the budget vs actual sets
- Monthly actuals and plans by account and product line.
- A budget plus three reforecasts a year, so you can see how the view changed.
- Units and prices, not only values — enough for price, volume and mix variances.
- A story to explain: a major customer leaves part-way through the year.
- At L3: three companies, many plan versions, one company on an April–March fiscal year.
Questions you will answer
- Revenue and profit variance against budget and against the latest forecast.
- How much of the revenue variance is price, volume and mix.
- Year-to-date and full-year outlook against plan.
- At L3: comparing plan versions, and reporting a group with two different fiscal years.