
Cash conversion cycle in Python — DSO, DIO and DPO with pandas
To measure working capital in Python, keep every movement of receivables, inventory and payables in one pandas table, add them up to any date to get the balances, and divide each by the matching three months of revenue, cost of sales or supplier invoices. DSO + DIO − DPO is the cash conversion cycle. The 43 lines of pandas below do this on a DATA DARE working capital practice set — a manufacturer with sixty customers and sixty-four suppliers — and the results agree with the answers in the set's Question Book.
The sets live now
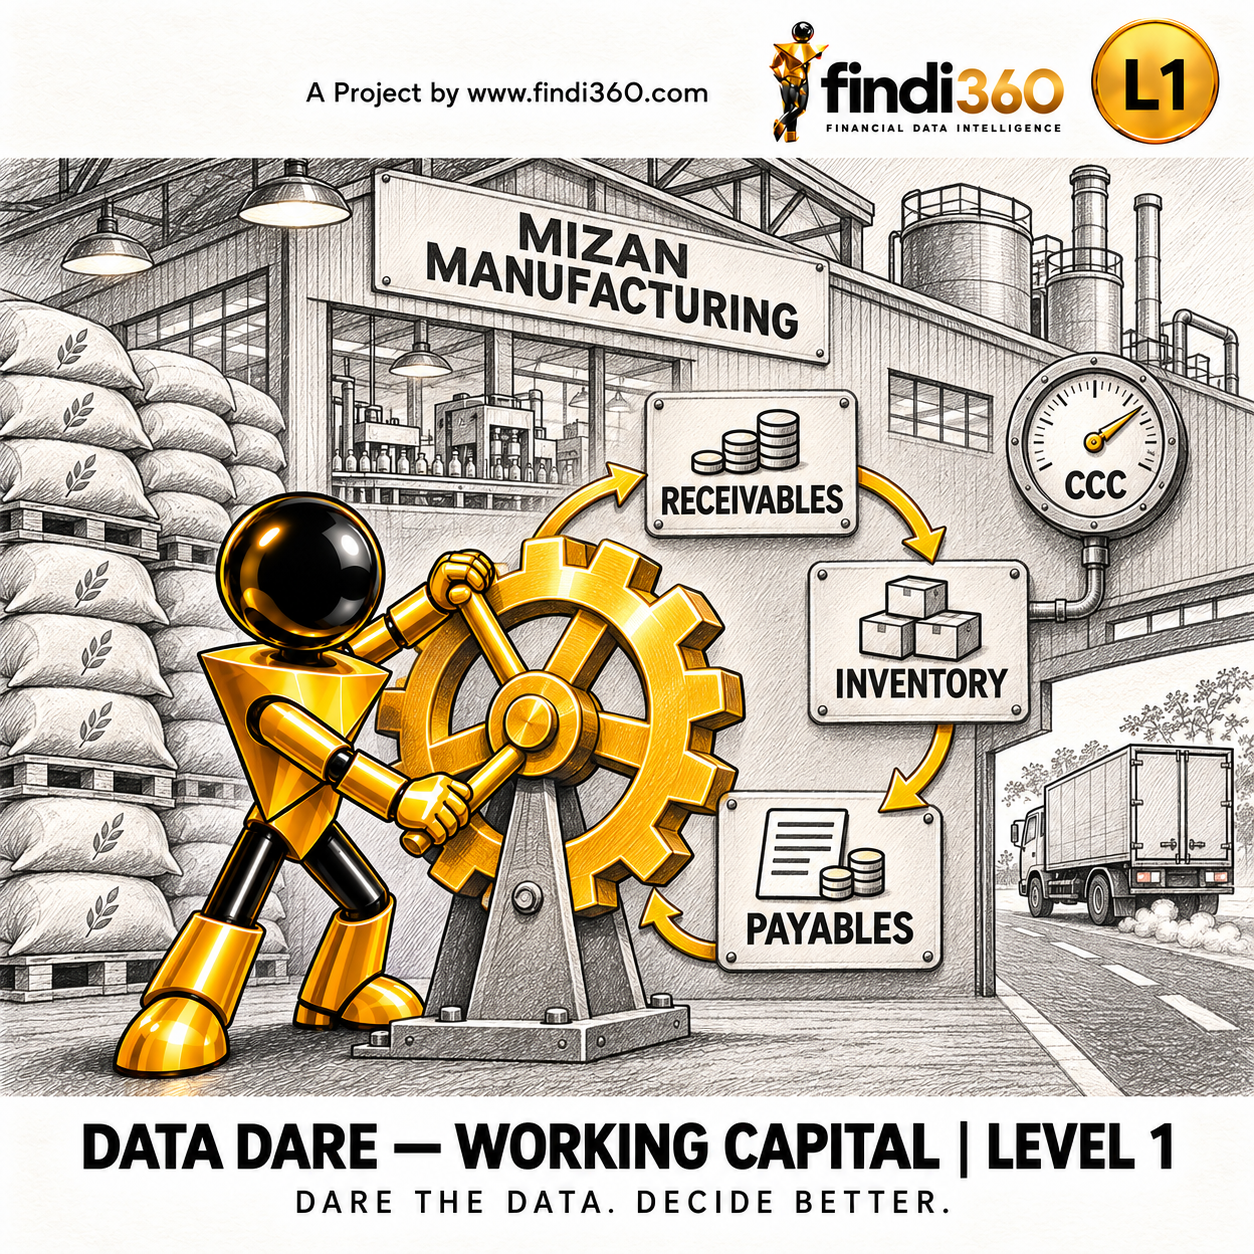
Mizan Manufacturing: Where the Cash Is Tied Up — Working Capital
Join receivables, inventory and payables of one manufacturer: build month-end balances from documents, work out DSO, DIO, DPO and the cash conversion cycle, mea...
Get the data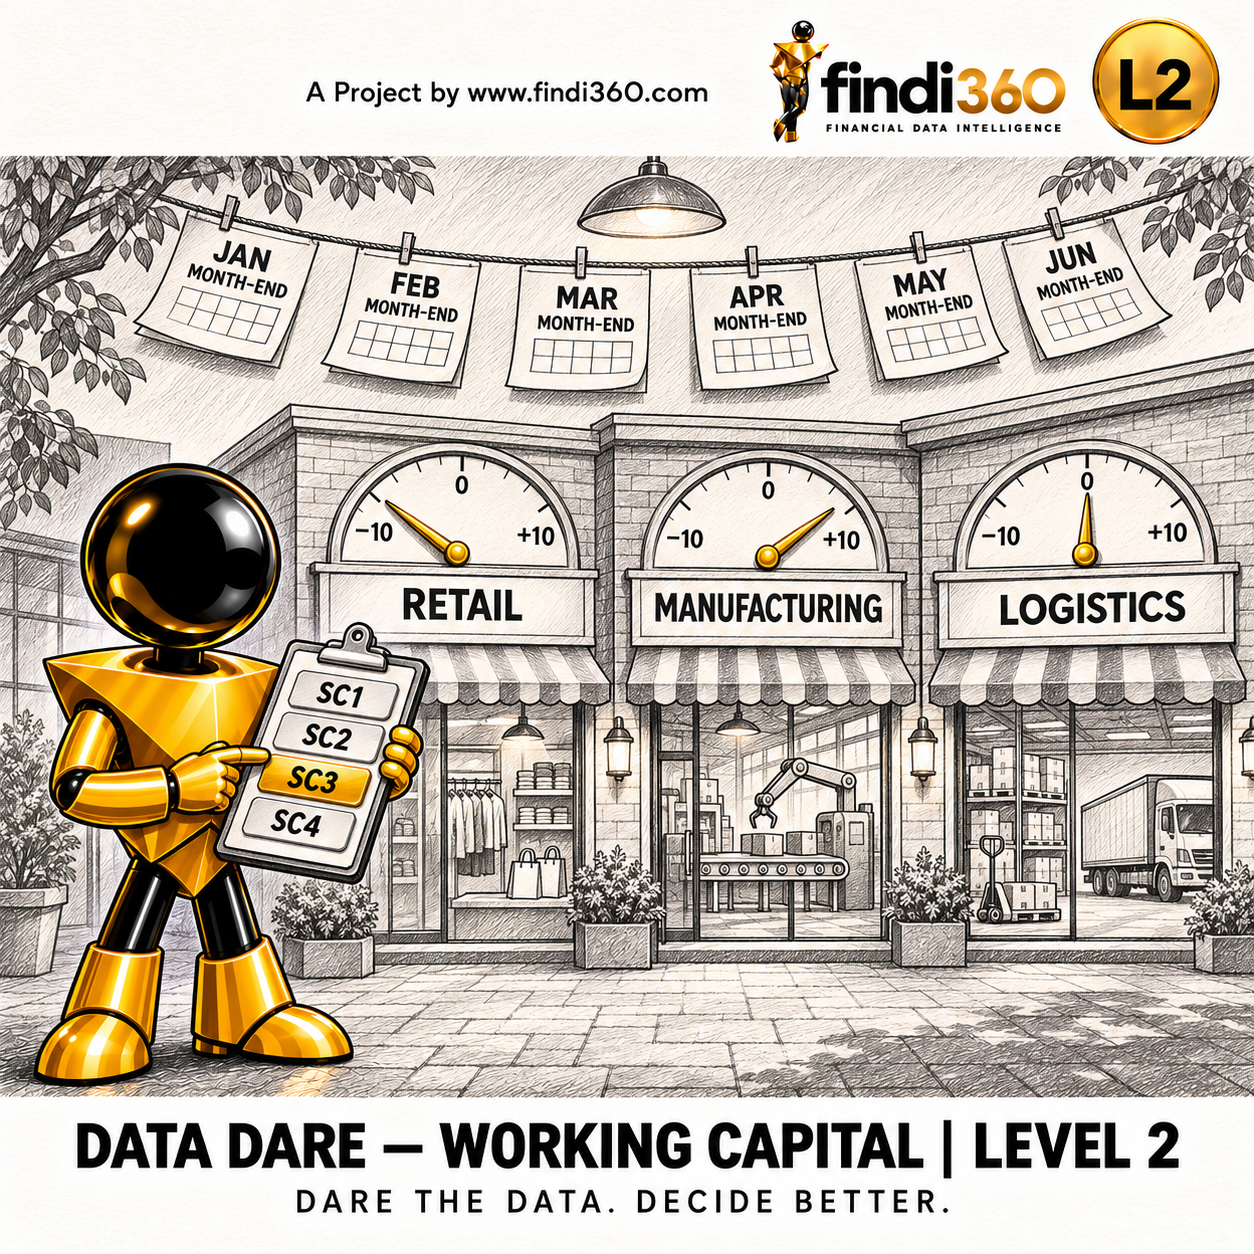
Mizan Group: Three Businesses, Three Cash Cycles — Working Capital
Read month-end snapshots of receivables, payables and stock across three companies, compare their cash conversion cycles with targets and price the CFO's scenar...
Get the data
Mizan Group: The Cash Conversion Cycle, Document by Document — Working Capital
Build the cash conversion cycle from the documents up: receivables, payables, goods received and card takings with the date each one was raised, posted, due and...
Get the dataThe steps
- Load the movements, the monthly P&L and the targets — three sheets of one Excel workbook. Invoices and stock received are positive; receipts, payments and stock issued are negative.
- Get each balance at a date: the sum of that component's movements up to the date.
- Divide each balance by the three months ending on the date and multiply by their days: receivables by revenue (DSO), inventory by cost of sales (DIO), payables by supplier invoices (DPO).
- The cash conversion cycle is DSO + DIO − DPO. Work it out for every month-end and compare it with the target.
- Working capital tied up is receivables + inventory − payables. Its change over a year is the cash the business released or absorbed.
The code
Download the L1 working capital set (DD-WCP-001) and run this in the folder that holds its Excel workbook. It needs pandas and openpyxl (pip install pandas openpyxl).
import pandas as pd

pd.options.display.float_format = "{:,.2f}".format
workbook = "DD-WCP-001_WorkingCapital.xlsx"

moves = pd.read_excel(workbook, sheet_name="FactWorkingCapitalMovements")
pl = pd.read_excel(workbook, sheet_name="FactMonthlyPL").set_index("PeriodKey")
target = pd.read_excel(workbook, sheet_name="FactWorkingCapitalTarget").set_index("PeriodKey")

# 1. A balance at a date = every movement of that component up to the date.
#    Invoices and stock received are positive; receipts, payments and issues are negative.
def balances(date):
    upto = moves[moves["MovementDate"] <= date]
    return upto.groupby("Component")["Amount"].sum()

# 2. DSO, DIO and DPO use the three months ending on the date:
#    receivables / revenue, inventory / cost of sales, payables / supplier invoices, x days.
def cycle(date):
    b = balances(date)
    months = [int(f"{d:%Y%m}") for d in pd.date_range(end=date, periods=3, freq="ME")]
    last3 = pl.loc[months]
    days = (date - (date - pd.DateOffset(months=3))).days
    dso = b["Receivables"] / last3["Revenue"].sum() * days
    dio = b["Inventory"] / last3["CostOfSales"].sum() * days
    dpo = b["Payables"] / last3["SupplierInvoices"].sum() * days
    tied = b["Receivables"] + b["Inventory"] - b["Payables"]
    return pd.Series({"DSO": dso, "DIO": dio, "DPO": dpo, "CCC": dso + dio - dpo, "Tied up": tied})

# 3. Every month-end of 2025, with the cash conversion cycle against its target.
ends = pd.date_range("2025-01-31", "2025-12-31", freq="ME")
table = pd.DataFrame({f"{d:%Y%m}": cycle(d) for d in ends}).T
table["Target CCC"] = target.loc[[int(k) for k in table.index], "TargetCCC"].values
table["vs target"] = table["CCC"] - table["Target CCC"]
print(table.round(2).to_string(), "\n")

# 4. The year-end position and how much cash the year released.
b = balances(pd.Timestamp("2025-12-31"))
print(f"31 Dec 2025: receivables {b['Receivables']:,.2f}  inventory {b['Inventory']:,.2f}"
      f"  payables {b['Payables']:,.2f}")
start, end = cycle(pd.Timestamp("2024-12-31")), cycle(pd.Timestamp("2025-12-31"))
print(f"Working capital tied up: {start['Tied up']:,.2f} -> {end['Tied up']:,.2f}")
print(f"Change over 2025: {end['Tied up'] - start['Tied up']:,.2f} (negative = cash released)")
print(f"Lowest cycle of 2025: {table['CCC'].idxmin()}")
What it prints
Every month-end of 2025, exactly as the script prints it:
         DSO   DIO   DPO    CCC       Tied up  Target CCC  vs target
202501 67.77 70.42 43.11  95.07 18,648,757.70          96      -0.93
202502 68.66 69.57 42.54  95.69 19,366,110.90          96      -0.31
202503 68.38 69.99 40.63  97.75 19,926,547.78          96       1.75
202504 67.17 73.98 42.24  98.91 18,802,747.62          96       2.91
202505 68.59 78.07 42.50 104.15 18,168,467.71          96       8.15
202506 63.96 80.56 41.54 102.98 16,664,095.84          96       6.98
202507 61.66 78.46 41.84  98.29 16,237,234.76          96       2.29
202508 65.45 77.56 45.10  97.91 16,416,189.18          96       1.91
202509 62.85 75.68 46.29  92.24 15,818,165.85          96      -3.76
202510 61.35 75.06 45.96  90.45 15,404,486.24          96      -5.55
202511 64.93 76.87 49.96  91.84 15,045,385.17          96      -4.16
202512 60.84 75.41 44.78  91.46 14,991,015.07          96      -4.54

31 Dec 2025: receivables 11,897,817.94  inventory 9,735,581.63  payables 6,642,384.50
Working capital tied up: 18,310,282.87 -> 14,991,015.07
Change over 2025: -3,319,267.80 (negative = cash released)
Lowest cycle of 2025: 202510
How to read the result
- On 31 December 2025 DSO was 60.84 days, DIO 75.41 and DPO 44.78, so the cash conversion cycle was 91.46 days — 4.54 days better than the target of 96.
- The cycle was above target from March to August, peaking at 104.15 days in May as stock built up (DIO 78.07 in May, 80.56 in June). Its lowest point was 90.45 days in October.
- Working capital tied up fell from 18,310,282.87 to 14,991,015.07 over 2025: 3,319,267.80 of cash released.
- The year-end balances, DSO, DIO, DPO, the cycle, the gap to target, the cash released and the best month are all questions in the set, so each figure can be checked in its Question Book.
Mistakes this data will catch
- Using a full year of revenue at a month-end. The ratios use the three months ending on the date and their real number of days.
- Dividing inventory by revenue. Stock is held at cost, so DIO uses cost of sales; DPO uses supplier invoices.
- Adding the movements of every date. A balance at a date counts only the movements on or before it.
- Reading a lower DPO as good news. Paying suppliers sooner makes the cash cycle longer.
The next levels
The L2 and L3 sets (DD-WCP-002, DD-WCP-003) come as CSV, JSON, Excel and Parquet files for a group: open items by entity, stock balances, scenarios, daily bank balances, supplier finance and holidays. The same three ratios carry over, entity by entity.
Python or Power BI
Python suits the month-end working capital pack: one table of DSO, DIO, DPO and the cycle for every month. Power BI suits the board view, where the date is a slicer and each ratio can be drilled into customers, items or suppliers.
The course
- Basic Python Course Free recording Basic Python takes you from never having written a line of code to scripts that do real work on your own files. You will cover the language itself, then move quickly to the part th...
- Python for Finance — Automation & Controls Coming soon Python for Finance — Automation & Controls is about the monthly tasks that eat a week and shouldn't. You will automate reconciliations, build controls that check data instead of tr...
- Python for Finance — Advanced Analytics & Reporting Coming soon Python for Finance — Advanced Analytics & Reporting is where the scripts stop being utilities and start producing analysis. You will work with datasets larger than Excel will hold,...
- Python + AI for Finance Workflows Coming soon Python + AI for Finance Workflows is about putting a language model inside a process, not chatting with one. You will build workflows that read documents, extract what matters, che...
- Data Transformation in Python — At Scale Free recording One export of 6.18 million dirty rows, cleaned in Python and reconciled to a total you can defend. For Power Query users who have never written Python. Amounts stored as text, thre...