
LBO Model in Excel — Leveraged Buyout Template with IRR, MOIC and Returns Bridge
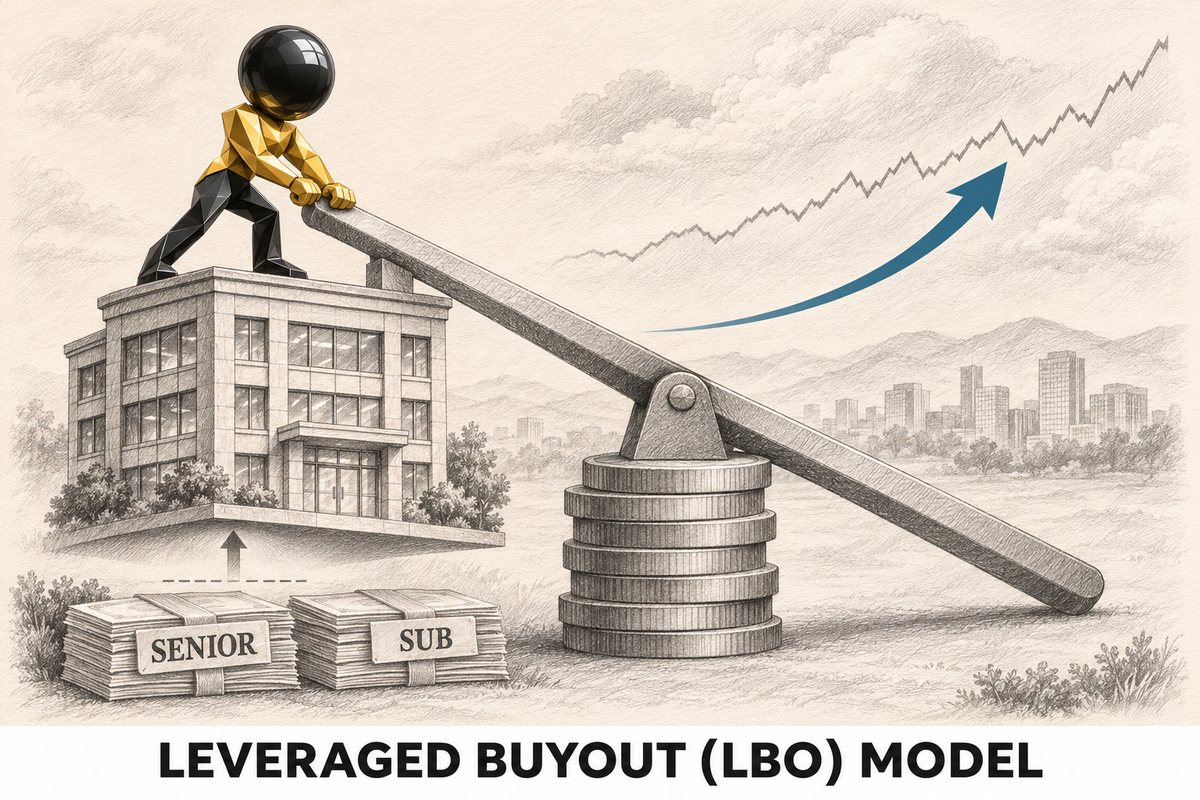
A leveraged buyout (LBO) model in Excel, built by findi360. It takes a company from entry to exit the way a private-equity sponsor does: price the deal from EBITDA and a multiple, fund it with a senior term loan, subordinated notes and sponsor equity, run a five-year plan, sweep spare cash into the senior loan, and measure the return as IRR and multiple of invested capital (MOIC) — then show where that return came from.
By findi360 · Updated November 2026
- Format
- Excel (.xlsx)
- Hold period
- 5 years (FY2026–FY2030)
- Outputs
- IRR · MOIC · returns bridge
- Works in
- Excel 2013 or later

What this model does
A leveraged buyout is the purchase of a company with a large share of borrowed money, repaid from the company's own cash flow. Banks lend against EBITDA, not against the price, so the model sizes both debt layers as multiples of EBITDA: a senior term loan with scheduled amortisation and a cash sweep that prepays it from every spare dollar above minimum cash, and subordinated notes at a higher rate, repaid in full at exit. Sponsor equity is whatever the debt does not cover.
The operating model runs revenue, EBITDA, depreciation, capex, working capital and tax for FY2026–FY2030 down to free cash flow. Interest is charged on opening balances, so there is no circular reference to break. With the sample deal — 8.0x EBITDA in and out, 5.0x leverage — the sponsor earns about a 24% IRR and 2.9x its money. The returns bridge splits that gain into EBITDA growth, multiple change, debt paydown, cash build-up and fees, and a grid shows the IRR at five entry and five exit multiples.
Use it for
- Learning LBO mechanics for private equity, investment banking or transaction-advisory interviews
- A quick returns check on a buyout or management buy-in
- Seeing how price, leverage, growth and margins each move IRR and MOIC
Inside the workbook
- Cover — What the model does, a contents list linking every sheet, and the checks to watch.
- Inputs — Only the yellow cells: price, fees, minimum cash, both debt layers, the five-year plan and the exit multiple.
- Sources & Uses — How the deal is funded, with sponsor equity as the balancing figure and a check.
- Operating Model — P&L to free cash flow for FY2026–FY2030.
- Debt Schedule — Mandatory amortisation, cash sweep, interest and net debt / EBITDA by year, with a minimum-cash check.
- Returns — Exit equity, IRR, MOIC and the value creation bridge, with a check that the bridge ties.
- Sensitivity — IRR across entry and exit multiples — every cell a live formula.
Who this model is for
- Candidates preparing for private equity and investment banking interviews
- Finance professionals and CFOs evaluating a buyout or acquisition
- Students learning leverage, cash sweeps and returns analysis
Frequently asked questions
What is MOIC?
Multiple on invested capital: the equity value the sponsor receives at exit divided by the equity it put in. It ignores time; IRR accounts for it.
Why are entry and exit multiples the same?
It isolates the returns that come from earnings growth and debt paydown — the bridge then shows zero multiple expansion. Change the exit multiple on Inputs to test expansion or contraction.
Is there a circular reference?
No. Interest is charged on each year's opening debt balance, so the cash sweep and the interest never depend on each other. Many LBO templates need iterative calculation; this one does not.
What does the cash sweep do?
Every dollar of free cash flow above minimum cash, after scheduled repayments, prepays the senior loan. Set the sweep to 0% on Inputs to see how much IRR the faster paydown is worth.
Keep going on findi360
- DATA DARE Group Consolidation: Subsidiaries, NCI & Intercompany DD-CON-002 · L2 — CSV / ~30,000 rows Multi-Currency Consolidation: Translation, Loans & Unrealised Profit DD-CON-003 · L3 — Parquet / ~500,000 rows
- DATA DRILL Test yourself — Power BI practice questions One question at a time, or a 50-question timed simulation.
- COURSE Courses and free recordings Power BI, Python and finance courses for finance professionals.
Related models
-
Manufacturing Financial Model & Feasibility Study
A four-product manufacturer planned from the factory floor up for ten years — production cost build-up, seven sensitivity cases, the three statements and four valuation methods.
-
IFRS 18 Financial Statements Model
A retailer's general ledger becomes a live trial balance and a full set of financial statements, with the profit or loss presented under IAS 1 as applied today and under IFRS 18 from 1 January 2027. Same profit, different operating profit.
Educational model on illustrative data. Not investment, accounting or tax advice. © findi360 — share freely with attribution.