
IFRS 9 ECL Model in Excel — Provision Matrix, PD, LGD & Pakistan Macro Factors
From the customer ledger to the ECL journal in one working Excel file. Paste a ledger of invoices, receipts, credit notes and write-offs and the model builds the age analysis, measures how balances roll from one bucket to the next, turns that into a probability of default and a loss given default, adjusts for the economic outlook and calculates the loss allowance — with the journal entries and the disclosure tables. Change one assumption — the reporting date, a scenario weight, a default threshold — and the allowance updates. Built by findi360 on a fictional pharma distributor in Pakistan, with 300 customers and three years of ledger.
By findi360 · Updated November 2026
- Format
- Excel (.xlsx)
- Method
- Provision matrix, with PD × LGD × EAD beside it
- Plug and play
- Paste your ledger — ageing, loss rates and journals update
- Data
- 300 customers · 34,133 ledger lines · 36 months
- Works in
- Excel 365 or Excel 2021

What is expected credit loss (ECL)?
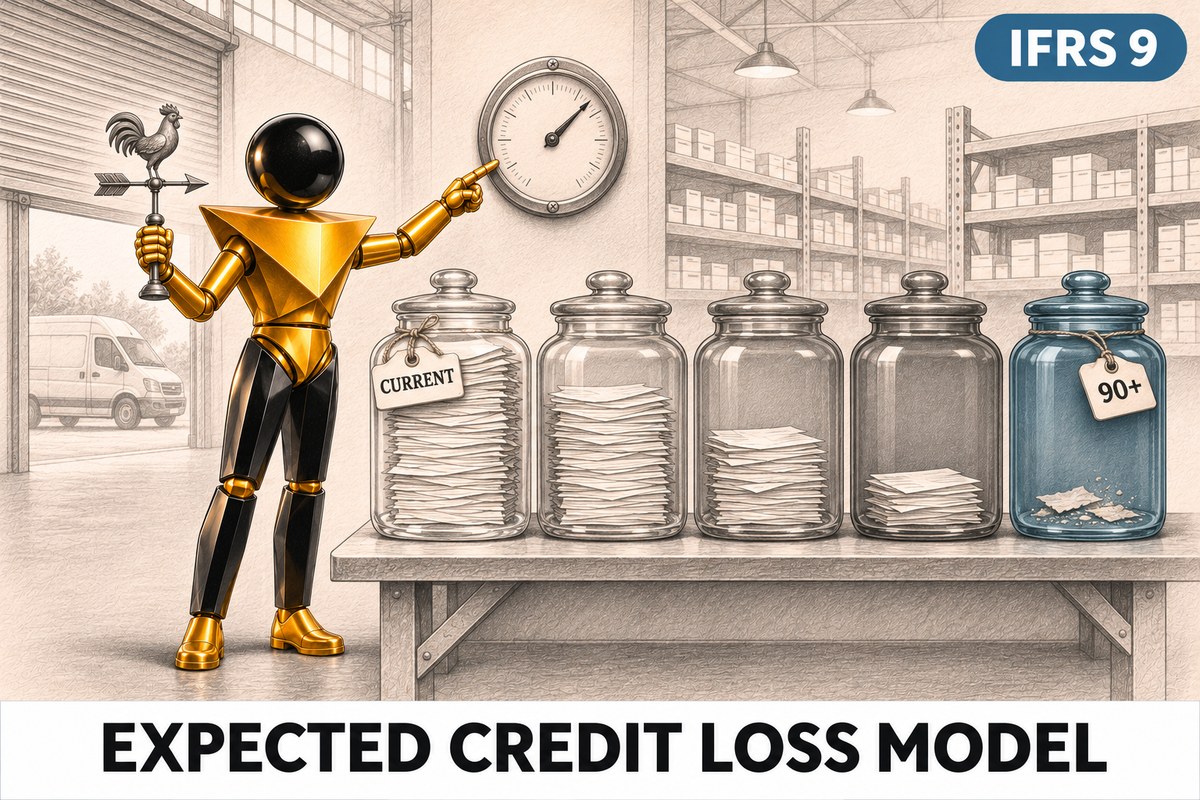
IFRS 9 asks a company to recognise a loss allowance for the credit losses it expects on its receivables — before a customer actually fails to pay. For trade receivables the standard allows a simplified approach: lifetime expected losses, usually measured with a provision matrix of loss rates by age.
A loss rate is not a guess. It comes from the company's own history — how often balances of each age went on to default, and how much was lost when they did — adjusted for what the economy is expected to do next.
How the model gets from a ledger to a loss rate
- Ageing — every open invoice is placed in a bucket by days past due, by customer type and by customer. Partly paid invoices are handled exactly.
- Roll rates — the same ageing is rebuilt for 36 month ends; the share of each bucket that is one bucket older a month later is the roll rate.
- PD — multiplying the roll rates up to the default threshold gives the chance that a balance in each bucket defaults.
- LGD — for balances that did reach default, what came back afterwards is measured, discounted for the delay, and the rest is the loss.
- Forward-looking adjustment — the company's default rate is set against GDP growth and the policy rate; three scenarios for next year move PD up or down.
- ECL — balance × PD × macro scalar × LGD under each scenario, weighted by probability.
Pakistan macro factors and scenarios
The Macro sheet holds eleven years of Pakistan's real GDP growth, CPI inflation, the State Bank policy rate, the rupee against the dollar and large-scale manufacturing growth, from the Pakistan Bureau of Statistics, the State Bank of Pakistan and the Pakistan Economic Survey. A base, a downside and an upside scenario for FY2027 each give their own allowance, and the reported figure is the probability-weighted average.
The figures are yellow input cells, so you can replace them with your own country's data. Check any macro figure against its source before using it in a real model.
Government receivables: late is not the same as lost
Government hospitals often pay well after 90 days without being a credit loss. The model lets each customer type have its own default threshold — 180 days for government, 90 for the rest — and measures the government loss mainly as the cost of waiting. Receivables from government entities in the power sector have had their own SECP and ICAP treatment; check the current directives before applying any ECL model to them.
Two methods side by side
The booked figure is the provision matrix. Beside it, the model calculates PD × LGD × EAD customer by customer — a 12-month default rate for the customer type, scaled to the life of a receivable, adjusted for the customer's rating and security. Where the two disagree is where to look more closely.
Customers already known to be in trouble are taken out of the matrix and assessed one by one, from the security held and the recovery the credit department expects.
Use it for
- Building or reviewing the loss allowance on trade receivables at a year end
- Learning IFRS 9 expected credit loss for CA, ICAP, ACCA and CFA exams and for interviews
- Showing auditors and the board how the allowance moves with the scenarios
- Practising on larger data: the DATA DARE expected credit loss sets (DD-ECL-001, DD-ECL-002) and the bank loan book sets (DD-BNK-001, DD-BNK-002)
Inside the workbook
- Dashboard — Controls for the reporting date, scenario weights and a macro shock; key figures, charts and the ten largest exposures.
- Assumptions — Default thresholds by customer type, age buckets, discount rate, security haircuts and rating multipliers.
- Customers and Ledger — The customer master and every invoice, receipt, credit note and write-off — the data you paste.
- Ageing and Roll rates — The age analysis at the reporting date, 36 month-end ageings and the roll rates between buckets.
- PD, LGD and EAD — Probability of default by bucket, observed loss given default by age, and exposure and security by customer.
- Macro and FLI — Pakistan macro history, three scenarios, the regression and the macro scalar applied to PD.
- ECL and Specific — The provision matrix by scenario, the PD × LGD × EAD comparison and individually assessed customers.
- Movement and Disclosures — Opening to closing allowance, the journal entries, IFRS 7-style tables and the sensitivity.
- Back-test and checks — Last year's allowance against what happened, and eight checks that must all read OK.
- Where Excel stops — Excel + Power BI + Python — where each tool does its part: scale, refresh, reporting, sharing and confidentiality.
Excel + Power BI — the Power of Plus
Excel does this model well when all five of these are true. When two or more are not, you add Power BI — not instead of Excel, beside it. That is the Power of Plus.
- One-off — you build it once, not again every month.
- Fixed structure — the same accounts, entities and layout each time.
- Small enough to check by eye — thousands of rows, not millions.
- One source — one ledger or one plan, not data scattered across systems and files.
- No live link needed — nobody expects it to update from the ledger by itself.
What it takes to run the allowance every month in Excel
- Paste the new ledger, fill the formulas down and re-check all eight checks.
- Save a copy for every month and every company — Excel holds one ledger at a time.
- Email the file, with every customer's balance in it, to each person who needs a number.
- Past a few hundred thousand ledger lines, wait for the workbook to recalculate after every change.
The same work, once it repeats
In Power BI the same measures refresh from the ledger on a schedule, each manager sees only their own customers, and anyone can drill from the allowance to the invoice. Python adds the PD models and the automated month-end run.
Power BI still needs your judgement where the data is new — but everything after that repeats by itself.
Learn it on findi360: Advanced Power BI for Finance
Notify me when it opensWant to see what scattered data looks like? Three ERPs, three currencies and one consolidated group: DD-CON-004 — Diversified Group Close: Acquisition, Goodwill & Multi-ERP Consolidation
Who this model is for
- Financial controllers and reporting teams preparing the loss allowance on trade receivables
- Auditors reviewing an ECL calculation and its assumptions
- Credit controllers who want to see what the ageing means in money
- Students and analysts learning PD, LGD and EAD on real-looking data
Frequently asked questions
Can I use my own customer ledger?
Yes — it is plug and play. Paste your customer list and your ledger (invoices, receipts, credit notes and write-offs, each tied to its invoice and due date), set the reporting date, and the ageing, roll rates, PD, LGD, allowance and journals update. The "Before you update" sheet lists the steps and the checks sheet tells you if anything does not tie.
What is the difference between the simplified approach and the general approach?
The general approach of IFRS 9 moves an asset through three stages and measures 12-month or lifetime losses depending on whether credit risk has increased significantly. The simplified approach, required for most trade receivables, always measures lifetime losses, usually with a provision matrix. This model uses the simplified approach.
How do roll rates give a loss rate?
A roll rate is the share of a bucket that is one bucket older a month later. Multiplying the roll rates from a bucket up to the default threshold gives the chance that a balance in that bucket reaches default. Multiplying that by the loss given default gives the loss rate for the bucket.
How do macro-economic factors change the ECL?
The model relates the company's past default rate to GDP growth and the policy rate. For each scenario it predicts next year's default rate and compares it with the recent average; that ratio scales PD up or down. The allowance is calculated under each scenario and then weighted by probability.
Is a government receivable in default after 90 days?
IFRS 9 presumes default at 90 days past due unless there is reasonable and supportable information that a longer period is more appropriate. Government customers that pay late but reliably are a common case for rebutting it. In this model each customer type has its own threshold, set to 180 days for government.
What is the journal entry for expected credit loss?
Debit impairment loss on trade receivables in profit or loss, credit the loss allowance. When a receivable is written off, debit the loss allowance and credit trade receivables. The Movement sheet shows both, and the amount needed to bring the general ledger to the required allowance.
What are PD, LGD and EAD?
PD is the probability of default — the chance the customer fails to pay. LGD is the loss given default — the share of the exposure not recovered. EAD is the exposure at default — the amount outstanding. Expected credit loss is PD × LGD × EAD.
Does it work for banks and loans?
No. Loans need the three-stage general approach. For a loan book, practise on the DATA DARE banking and IFRS 9 datasets, DD-BNK-001 and DD-BNK-002.
Keep going on findi360
- DATA DARE Mizan Building Supplies: How Much of the Receivables Will We Collect? - IFRS 9 Expected Credit Loss Fundamentals DD-ECL-001 · L1 — XLSX / ~10,000 rows Mizan Building Supplies: Two Companies, Three Scenarios and a Booked Allowance That Does Not Agree - IFRS 9 ECL DD-ECL-002 · L2 — CSV / ~30,000 rows
- DATA DRILL Test yourself — Power BI practice questions One question at a time, or a 50-question timed simulation.
- COURSE Courses and free recordings Power BI, Python and finance courses for finance professionals.
Related models
-
Bank Reconciliation Template
A three-way bank reconciliation: sales to provider settlement reports, payouts to the bank statement, and the bank to the cash book — with clearing accounts, a fee audit, the reconciliation statement for two months and every journal to post.
-
IFRS 18 Financial Statements Model
A retailer's general ledger becomes a live trial balance and a full set of financial statements, with the profit or loss presented under IAS 1 as applied today and under IFRS 18 from 1 January 2027. Same profit, different operating profit.
-
Business Valuation Model — 10 Methods in 1 File
Ten valuation methods on one private manufacturer — DCF, FCFE, dividends, residual income, trading and deal multiples, net asset value, the VC method, sum of the parts and an LBO buyer's view — driven from one Summary, with a football field and the impact of a capital injection.
Need a model we have not built yet?
Tell us what you need. Members vote, and the most-requested models are built first — free to download.
Educational model on illustrative data. Not investment, accounting or tax advice. © findi360 — share freely with attribution.